2012 Participants
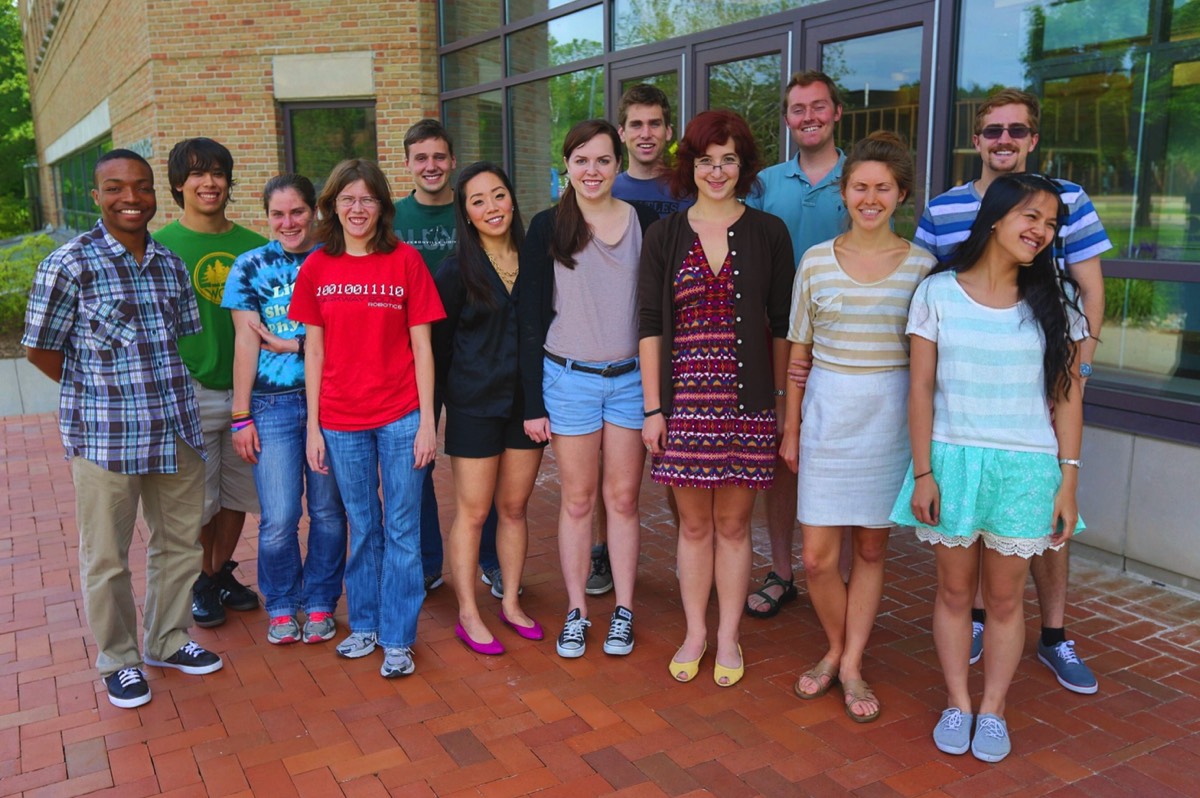
First Day of the Program
From Left to Right: Joshua Mann, Mir Henglin, Margaret Lutz, Laura Maguire, Jay Angel, Linda Lee, Lauren McLeod, Caleb Holt, Chrissy Porter, Andrew Kerr, Kiersten Daviau, Zak Burkley, Ngoc Chau Vy

Last Night of the Program
2012 Projects
Jay Angel:
The first week was spent being introduced to the instrumentation. The set up uses a Picometrix pulse laser that supplies a signal to the transmission antenna through an optical umbilical. The optical signal hits a semiconductor material that is made out Gallium Arsenide. On the outside of the width of the optical beam sit two electrodes. The pulse of this signal creates electron holes in the semiconductor and this produces an electrical potential. This changing potential creates an electromagnetic wave that goes through the lens in the antenna. This electromagnetic wave is of terahertz in nature. In order to image an object this terahertz signal will reflect off the image and go into the other antenna, which takes this electromagnetic signal and produces and optical signal. Then the signal is analyzed using multiple computer programs created through LabView.
For practice the instruments were set up to image an old coin. This was done using normal reflection that requires a collinear adapter. This adapter attaches the two antennas together at ninety degrees and uses a beam splitter to send the signal to the receiving antenna. This process introduced the practice of maximizing the signal using translation stages, adjustable mounts, and position on the optical table.
During the first week the set up was brought to an art graduate school (INP) to image a Fresco Painting. This meeting was arranged because this Fresco was believed to have a much older painting underneath the visible painting and in theory terahertz should be able to see this. The setup used x and y mechanical translation stages. These are controlled using the LabView programs as the antenna scans. The max signal was found using a third manual translation stage on the axis perpendicular to the paintings surface and the angle at which the signal hits the surface. After a long day a small portion of the painting was imaged and ready to be analyzed. The graduate student had prepared several small samples of different kind of fresco’s to be used a references.
The following week was spent imaging these samples using a similar setup as at INP. This time data processing was up to the students. This was done using an image calculator program made in LabView. The program lets a specific part of the signal to be looked at in many different ways. Some of these are the time domain, the frequency domain, the minimum peak, and the max peak. If any of these produce a satisfactory image it is saved. This file is then open using an image-editing program (ImageJ) to enlarge the picture. This was done for all of the samples and only a very small amount of the scans produced images where the hidden fresco was hidden.
When this was completed scans of twenty-three different pigments were imaged to be used a references for the advisors colleagues. These scans were using transmission and for each sample a front and back image was used
After this the instrument was brought to a company called Imagine Optics. This company makes a deformable mirror that can correct wave fronts. This technique has been proven to work using visible light and the company wanted to see if it did the same for terahertz. In order to see if the terahertz wave front changed a knife-edge scan was taken. Bringing a knife down perpendicular to the beam at its focal point to see if the mirror changes the spot size tested this. After a few weeks the company analyzed the data and showed that the spot size did in fact change.
The next day the analysis of the fresco painting data was presented at LMRH, which is a center for restoration and conservation of monuments and buildings. The results of the fresco samples where shown first and then images of the actual painting were shown. In these images it was agreed upon that a face can be clearly seen which is not part of the surface painting.
The following week three days were spent imaging cave etchings in Derbyshire England. The etchings were located in caves at Cragswell Crags. The collinear adapter was used to images these as well as a large tripod as the etchings were about six feet above the ground. This work was done in partnership with archeologists that were at the site excavating an area in front of the opening of the cave as well as a group of this project’s advisor’s colleagues from England. With such a large amount of people on a single scan the students were left to mostly grunt work which included; heavy lifting, maintaining the generator, setting up, taking down the set up, and manufacturing a platform out of spare material that could support the tripod and antennas with minimal vibrations.
The next two weeks were spent imaging a resolution target. This target was imaged using normal refection, off-axis refection and transmission. While imaging this target several problems arose. First it was observed that when imaged using the smallest step size the data was not being saved properly. In order to correct this the data was selected to be saved by pixel number instead of position. Then when this switched the data appeared all right but the images themselves appeared to be mirrored and useless. Later on it was found that the original data saved by position could still be used and produced excellent images.
Kierstin Daviau:
This summer I worked with a Picometrix Terahertz laser system on Cultural Heritage and Artifact Preservation under the supervision of Bianca Jackson and in conjunction with the Louvre (Centre De Recherche et De Restauration De Musees De France (C2RMF)). The purpose of this ongoing research project is to use terahertz radiation to image cultural artifacts in order to learn more about their sub-surface layers in a non-destructive fashion. I worked closely with another iREU student, Jay Angel, on a project in which we learned the theory behind the terahertz laser’s production, used the system to take scans of a variety of samples, analyzed the data we collected and joined Bianca to observe and help out on several on-sight research expeditions.
Our terahertz laser was a pulsed beam emitted through a transmitter lens and then picked up by a receiver lens attached to a computer which displayed the signal as a waveform. By placing a sample between the transmitter and receiver we were able to detect the signal after it had either been transmitted through the sample or reflected off the sample’s surface. When scanning a sample, our raw data consisted of one waveform for each step (pixel) of the scan. The finest step size our motorized translation stages allowed was 100 microns. We used a software program written in labview which organized the waveforms to correspond to their position on the sample and created an image based on the intensity of different aspects of the waveform.
The first set of measurements we took was on a series of plaster samples provided from the Institute National Patrimoine, an art restoration school funded by France’s Ministry of Culture. Our samples consisted of patches of pigment painted onto four different bases and then covered with nine different combinations of materials (a total of 36 samples). We scanned each sample using a normal reflection set up in order to see how the different surrounding material’s affected our ability to pick out the pigments. After creating a variety of images, we found only three samples in which the pigment was visible. Our poor results may have been due to the construction of the samples themselves, as they had irregular surfaces and compositions, characteristics which our images showed clearly rather than the pigments.
We then took measurements on a series of different colored mixtures of dried pigment and casein (a protein used as a binder in paint) provided from the University of Reading in the UK. Rather than scanning the entire surface of each pigment we instead focused on one pixel at a time, averaging together a large number of received waveforms to find one, accurate waveform for the pigment. We ran several trials per pigment sample and measured the width of the samples at the places we measured. Using this data we were able to find the indexes of refraction of the samples and compared how this changed with the color. This data will be sent back to the University of Reading for a master student’s research.
Our final set of measurements was done on a resolution target sent from Teraview (dimensions of 25 mm x 25 mm). The target was covered with differently spaced, reflective dashes which we scanned with normal reflection, transmission, and off-axis reflection lens set-ups in order to determine how fine of a line the terahertz could pick out. We ran into difficulties with the way our software saved files, as we were running scans with the smallest step size our translation stages allowed, resulting in large amounts of closely spaced data. After some trial and error, Bianca helped fix the problem, allowing us to analyze the data we had taken. The best images we created had a resolution of about 350 microns.
In addition to collecting our own data, Jay and I accompanied Bianca on several on sight research trips. The first week of the program we traveled to INP (Institute National Patrimoine) to image a fresco in the hopes of seeing whether another, older painting lay beneath the surface. Our results look promising, as we can see a face with the terahertz which isn’t visible on the surface, and it has been proposed that the top layer of the fresco be removed to see if our images are accurate. We then traveled to Imagine Optics, a small institution in Orsay, Paris which produces a deformable mirror which has been proved to improve the wavefront and decrease the spot size of visible light. We provided the terahertz laser to see if such improvements could also apply to light of a longer wavelength. Our results were preliminary but hopeful, meaning that further testing will be done in the future. The final trip we took was to Creswell Crags in Derbyshire, England to image the oldest cave paintings in the UK (estimated at around 13,000 years old). We imaged an etching of either a woman or a bird (it is still disputed what the etching depicts) in order to see if our terahertz could pick up the lines both visible to the naked eye and those covered up by mineral deposited flow rock. The data is still being analyzed, though our raw data images clearly display the uncovered lines and possibly some of the covered as well.
This has been a unique research experience as we were able to not only develop a better understanding of optics but were also able to discover some of the many different (and unexpected) fields which physics is applicable to. On our onsite visits we had the chance to talk to archeologists and art restorers, seeing how scientific collaboration plays out on an international level. This interplay and overlap between careers and countries was the most interesting and thought provoking aspect of my research here and something which will play a large part in my decision for graduate programs.
Caleb Holt:
I spent the summer working under Rodrigo Lopez-Martens, PhD student Aurelion, and post-doc Antonin. I was joined by Matthieu Fechant, a student at École Normale Supériere, one of the top schools in France (or the top one depending on who you ask) for theoretical physics, and two high school students, Mathieu and Michael. During my first two weeks there, I helped clear the lab out and set up the new laser blocks. I also learned how to start the 50 Watt green pump laser.
After that, I found out about Mach-Zehnder Interferometers, and how to set one up with Michael, the first high school student. We used the interferometer to measure how stable the target was. Our target needs to be stabilized down to ~10 nanometers, in order to accurately control the attosecond pulses, which is the overall goal of our lab. They are created by focusing a very high powered laser down to the order of a micron onto a glass target. This creates a solid-density plasma, which acts as a relativistic oscillating mirror, basically reflecting the light and imparting energy to the light. However, light cannot increase its speed because it’s light, so instead the pulse compresses and becomes much shorter, down to attosecond pulses (~10^-18). In more detail, what happens is the electric field of the light oscillates the electrons of the plasma, which then create the attosecond pulses. The target needs to stay within the Rayleigh length of the focused spot, and also needs to rotate smoothly so all pulses are reflected in the same direction. We also need to ensure that the laser strikes a fresh part of the target that is optically smooth (the glass target itself changes by 1/20 of a wavelength of light over the entire surface), or else the light will not be reflected correctly.
My overall project for the next couple of weeks would be to test how stable we could successfully make the target. The Matthieu’s arrived the following week, and we went over the program we would use to minimize the noise. We also ran the motors of the target for the first time and saw the target rotate and how that rotation affects the fringes of the Mach-Zehnder interferometer we had built the week before. In order to minimize the noise, we tested the motor of the original, which was a homemade gadget, against a manufactured motor. The manufactured motor was terrible. It would shake the target so much our software for observing the fringes could not function properly. We did run a couple of other tests using a millitron and a coarse alignment method to see if it even rotated properly. However, the shaking was still so violent that the screws holding the mirror in place in the mount and the screws for aligning the mount would jiggle out. After replacing the original target system, we worked on minimizing the noise by covering up the paths of the lasers, and turning on the vacuum chamber. What we ended up concluding was that the system was most stable when there was minimal movement going on in the room itself. Covering the paths helped a little, but the biggest improvement we observed was when no one moved.
Zak Burkley:
This IREU experience gave me the opportunity to participate in two projects that were taking place at Laboratory for the Utilization of Intense Lasers (LULI), a plasma physics laboratory at Ecole Polytechnic, during the summer of 2012. Specifically, I was involved in a project regarding the collimation of plasma plumes with magnetic fields as well as an experiment designed to study the collision of two plasma jets.
Working alongside Julien Fuch's Ph D student, Bruno Albertazzi, I helped analyze the data from Bruno's recent experiment regarding a poloidal magnetic field collimating a plasma jet. Using a pre-existing Matlab code designed to obtain plasma density graphs from interferograms, I individually analyzed the interferograms obtained from numerous different laser-driven plasma shots. Since only a certain spatial portion (approx 4 mm) of the plasma jet can be analyzed via interferometry with each shot, my individual goal was to combine plasma shots that shared all the same variables, except location in space, into a continuous plasma jet of approximately 10 - 20 mm in length. Using these combined density plots of the plasma, the group I worked with hoped to confirm the accuracy of existing computer code that simulates a plasma jet interacting with a poloidal magnetic field. As well, since our group hopes to publish these results, I was required to create an aesthetically focused Matlab code in order to produce graphs that match the quality found in peer-reviewed journals.
The other project in which I was involved dealt with an experiment run by Lorenzo Romagnani designed to study the collision of two plasma jets. This consisted of 1.5 weeks of set-up and 1.5 weeks of running the experiment in the LULI 2000 experimental room. During set-up I assisted in mounting optical equipment, creating the beam paths, aligning the lasers, and helping Lorenzo whenever needed. While the experiment was running I aligned the targets for each shot. This consisted of using a microscope setup to align the two aluminum wires that were then ionized to generate the colliding plasma; it also involved aligning the gold target used to create the laser-driven accelerated proton beam. As well, I assisted in creating dosimetry packets from radiochromic film sheets that were used to detect the proton beam after interacting with the plasma in order to map the plasma's electric field.
As seen in the description of my experience above, my time at LULI allowed me to not only gain insight regarding the computer work involved in the analysis of data obtained from plasma physics experiments, it also gave me the chance to personally set up a plasma physics experiment and observe how the data is actually collected. The result was a tremendous increase in my knowledge in plasma physics, high-energy laser experimental work, and graduate physics as a whole. As well, the chance to interact with and develop relationships with such a diverse spectrum of scientists taught me how imperative collaboration is for successful science. This was truly a phenomenal experience that will be benefit me not only in my future scientific aspirations but personal as well.
Joshua Mann:
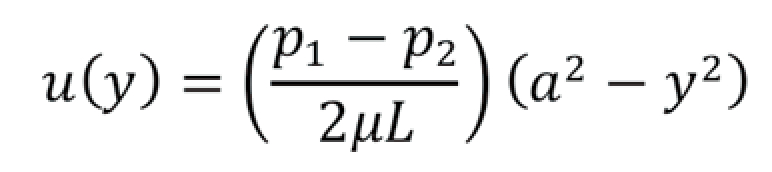
The research project that I worked on this summer was titled “Modeling the Pressure, Temperature, and Velocity Profiles of a Laminar Flow Gas Lens”. The primary goal of the project was to develop the theory that would be needed to construct a gas lens for an ultra-intense laser. Although outside the scope of my research, the potential applications of this technique would be to focus the laser pulse over an extended distance. My specific research objectives were to investigate the phenomena of laminar fluid flow and heat transport of an ideal gas, use this knowledge to determine the velocity, temperature, and density profiles of the gas lens, and model these profiles for helium and xenon gas.
The investigation of the laminar fluid flow theory allowed me to clarify the conditions and configuration of the gas lens model. One necessary condition for this model is that the speed of the gas be significantly lower than the speed of sound. This ensures that the flow remains laminar and the velocity profile remains constant with respect to time at every point in the flow. Another necessary condition is that the flow behaves as a continuum. Consequently, the pressure density of force and the viscous density of force can both be determined by taking a small fluid element (representing the average of a large number of particles) and integrating it to determine the pressure, temperature, and viscosity of the fluid as a whole.
The result of applying laminar flow theory to the gas lens problem was the equation for the velocity profile of the gas as a function of its position between the flat plates.

The investigation of the heat transport phenomena of an ideal gas allowed me to respectively clarify the thermodynamic conditions of the gas for this theoretical model. Firstly, the gas is assumed to behave ideally and therefore the molecular theory of gases can be applied to relate temperature and pressure. Also, the gas lens is considered to be an isolated system such that no energy is lost from the plates to the surroundings. The gas, however, does become colder the farther it travels down the tube because it exchanges thermal energy with the flat plates. Finally, the temperature of the flat plates is maintained throughout the entire length of the lens.
I am currently in the process of coalescing all of my work into one 10-page research paper. This paper will include the temperature profile results and the models for helium and xenon gas. The future goal of this theoretical model is to include a plasma model of how the gas interacts with the laser during the lensing process.
Lauren McLeod:
This summer I worked at the Laboratoire d’Optique et Biosciences at l’École Polytechnique in Palaiseau, France, where I was advised by Antigoni Alexandrou and Cédric Bouzigues and supervised by Rachid Rezgui. My work involved studying the interactions of individual molecules of DNA and proteins using single-molecule fluorescence spectroscopy. For his Ph.D., Rachid has been studying association and dissociation kinetics of proteins, called flap endonucleases, that repair DNA that has been split into single strands. I spent the summer both in the laboratory taking images of these interactions using TIRF microscopy and at the computer working on MATLAB code to analyze the images.
In these experiments, Rachid and I used flap endonuclease 1 (FEN-1), an enzyme that is present in humans, and NucS, a repair enzyme that is present in certain archaea. These proteins are labeled with the organic fluorophore Alexa 488, as are the constructs of damaged DNA. Often in other single-molecule interaction studies, differently colored fluorophores are used to distinguish the different molecules. However, in order to use only one laser for excitation and avoid chromatic aberration, our group chose to use the same color for both proteins and DNA. This then requires that we fix and locate the DNA before allowing them to photobleach, or permanently stop emitting light, then introducing the protein and seeing if any appear at the sites where we know DNA to be located. Since the length of the flap that is free to rotate is much less than the length of a pixel, we need sub-pixel resolution to determine if the protein that appears is actually close enough to the DNA flap to be interacting with it. We can achieve resolution of about 0.1 pixels by fitting the intensity surrounding the spot on the image to a 2-D Gaussian function, corresponding to the Airy disk of the fluorophore, and thus finding the actual location of the fluorophore, within the pixel.
The code that Rachid and I collaborated on locates the spots corresponding to DNA attached to the surface, determines their location to a precision of 0.1 pixels, then searches for the reappearance of a spot corresponding to a protein at that location after the original spot had bleached, and attempts to fit the intensity around the spot to a 2-D Gaussian. If the fit is good and the protein is close enough to the DNA, an interaction is assumed to be taking place, and the length of the interaction as well as the length of time since the introduction of the protein is determined. We are interested in the on and off rates for the interaction between the DNA and the protein; for the on rate, we need the wait times before an interaction occurs, and for the off rate, we need the length of the interactions. We take the cumulative distribution functions of these and fit them to a linear function for the on rate and a member of the class of exponential functions for the off rate. The contributions I made to the MATLAB code reduce the amount of time it takes to analyze each set of images from several hours to several minutes.
Margaret Lutz:
This summer I worked under Victor Malka in the research group SPL – Source de Particules par Laser – at LOA. The group’s main focus is particle acceleration using jets of gas that have been ionized by ultra-fast laser pulses. I worked on three distinct short projects for François Sylla, Jérôme Faure, and Cedric Thaury, members of the research group.
François Sylla was interested in different methods for imaging the gas jets. One old tried and true method is to construct a basic Mach-Zehnder interferometer with one arm through empty space and the other through the gas jet in an evacuated chamber. A camera at one end captures the interference patterns of reference shots and shots with the gas. These images can then be analyzed in a computer program written in MATLAB which generates both phase maps and density profiles at different heights. The difficulty with this method is that it breaks down in lower pressure regimes, with the gas at pressures of 2 bars for instance, there was so much noise and so little meaningful data that a realistic density profile could not be constructed.
We (Madeleine Le Bouteiller, my French lab partner, and I) set up the Mach-Zehnder and we compared the data from that to data taken by a Phasics system camera, which directly produced images of the phase maps when the gas jet was illuminated by an LED light source. We imported the Phasics images into the same MATLAB program, and we used gnuplot to make professional looking graphs. We then each wrote a report comparing the two methods of analysis. The Phasics camera was clearly superior in generating density profiles for low pressure regimes, and it also had the major advantage that the total setup time was only an hour or so instead of the hours and hours needed to set up the interferometer. The camera was eventually purchased.
Jérôme Faure was going to be going to Michigan CUOS to do experiments with some new nozzles that hadn’t been used before so Madeleine and I were tasked with providing density profiles and phase maps of some of them so he could know what kind of gas densities to expect for different applied pressures. To do this we set up another interferometer with an arm passing through the gas jet at a right angle to the first one so that we could run a tomography program to get a more thorough representation of what was going on. This was more difficult than we anticipated because the two different images had to have the same magnification, but they eventually did and we were able to take shots for two different nozzles at three different pressures. We took that data and then ran it through a MATLAB program similar to the first one except that it could take multiple images at the same time and make a two dimensional density profile at a given height above the nozzle instead of just the one dimensional profiles. We then took those and put them together in another report.
Cedric Thaury had an infrared spectrometer that he wanted to properly calibrate. Because we didn’t have a laser available that would give a wide range of infrared frequencies we were using a blackbody source. The issue with this was that we needed a collimated beam of light to send into the spectrometer setup. To achieve this I used a small off-axis parabolic mirror and put the blackbody source at the focal point. This was virtually impossible to align correctly given the mirror mounts available, but I came closest by setting up a laser with five pinholes – two before and two after the mirror, and another one between the laser and two mirrors that leveled the beam. First I set the mirror at exactly a right angle and then located the focal point and put an adjustable slit exactly there with the source just behind it. The fairly collimated beam of light was then sent into a system of more mirrors and finally through a prism and a lens to separate out the different frequencies before they hit the spectrometer. The spectrometer was eventually calibrated so that 1um and 10 um were reasonably fitting on the screen at the same time.
Chrissy Porter:
This summer, I worked in the Laboratoire d’Optique et Biosciences (LOB) at École Polytechnique, with Willy Supatto, Emmanuel Beaurepaire, and Max Zimmerley. Our project was to use polarization-sensitive third harmonic generation (THG) microscopy to study the dynamics of zebrafish otolith development. This method provides a way to perform 3D, in vivo imaging to study biological crystal development with excellent spatial resolution, which was not previously possible.
THG requires no labeling of the biological sample and is minimally invasive, so zebrafish embryos may be imaged for over 24 hours without damage, allowing us to study the growth dynamics of the otolith. The otolith is the inner ear stone of the zebrafish, serving to give the fish balance in much the same manner as the inner ears of humans. Otoliths are made up of a conglomeration of aragonite crystal domains which grow at different rates in a manner that is not yet well understood. While there is usually no THG signal from a bulk medium (it is traditionally used to look at the interfaces between media), a signal may be obtained from birefringent crystals such as aragonite.
We imaged seven batches of zebrafish embryos this summer. I performed almost all of the imaging myself, using a THG microscope that was intact when I arrived. We took “xyzp” images of otoliths, wherein at many depths in the otolith (z) we took images in the xy plane using seventeen different input polarizations (p). We took about six xyzp images of the same fish over the course of 24 hours, so that we could watch the development of the otolith in a sort of stop-action film. This was repeated for eight different fish.
When I was not imaging, I worked primarily on theory development and image processing code for our group. I derived a function that gives the expected THG output polarization as a function of the 3D orientation of the aragonite crystal, the orientation of the incoming electric field of the laser beam, and the third order nonlinear susceptibility of the crystal. I was then able to fit the measured intensities of the THG signal at the 17 input polarizations of the laser to this function for each pixel in our images. These fits allowed me to extract the orientation of the aragonite crystal at each pixel.
When I began the fitting process, we did not know the ratios between the three third order susceptibility tensor components that appeared in my function. However, after leaving these susceptibility components as fit parameters in a large sample of pixels from various otoliths, I found that I got quite consistent ratios between them. This was a good indication that my function was correct, and it allowed me to set the susceptibility components as constants and only fit the crystal orientation and the input polarization orientation from then on.
I wrote Mathematica code that took an input stack of xypz images for an otolith at a given time (about 350 images) and performed fits of these images to the function that I derived, extracting the crystal orientation at each pixel in the plane, for each depth. The code then plugged these fit parameters back into the function and calculated the expected output THG signal at each pixel. Projecting the signal onto the detection plane and color coding the angle of the output polarization in the plane allowed my code to produce images of the crystal domains. Thus, I condensed the information from 350 raw images down to about 20 processed images (one for each depth in the otolith). I parallelized my code and got it running on the Linux cluster at LOB, such that we could process an entire xyzp stack in about six hours (a 9x increase in speed over running the code on my computer alone). The images we produced with this method were consistent with the appearance of the raw data as hoped, and showed very interesting growth dynamics when our processed stop-action image stacks were compared.
Ngoc Chau Vy:
Polarization-Sensitive THG Microscopy Study of PbS Nanocrystal in Hair Samples; Research Performed at École Normale Supérieur de Cachan
Lead-based hair dyes were used in Ancient Egypt more than 4000 years ago. One of these formulas, which were passed down through the Greco-Roman period, contains primarily lead oxide (PbO), slaked lime (Ca(OH)2) and water. When applied to hair, sulfur from the amino acids that make up hair keratin react with the PbO to form black lead sulfide (PbS) nanoparticles. What’s special about these nanoparticles is that they emit third harmonic generation (THG) signals when excited with near infrared wavelengths. We can take advantage of this property by applying it to a typical confocal microscopy set-up and what results is much more powerful and informative non-linear microscopy.
Ultimately, we would like to apply this technology to study hair samples from mummies in a collaboration project with the Musée du Louvre. Before we can study precious mummy hair, we must first have a deep understanding of what happens in normal hair. In essence, what we did was simulate the hair dying process on normal human hair and studied those samples first.
Cross sections of hair were treated with a lead oxide solution for periods of one, two and three days, after which they were transferred to glass slides and glued down. The prepared slides containing PbS nanocrystals in the hair cross sections were then viewed with a confocal microscope using an oil immersion objective lens. After locating the hair on the slides, we excited them using a Mai Ta Ti:Sapphire femtopulse laser, whose 776 nm beams are lengthened to a final wavelength of 1290 nm with an optical parametric oscillator. The hair cross sections were scanned after excitation for THG signals, which have an expected wavelength of 435 nm and appear as bright spots. The wavelengths of the bright emission spots were measured with a spectrometer to ensure that they were indeed THG. When taking scans of the hair, we made sure to view different parts of the cross section, such as the medulla, or center of the hair, the cortex, which is the area immediately surrounding the medulla, and the interface between the inside of the hair and the environment.
To have a better understanding of the optical properties of the PbS nanoparticles, we also performed a study of the intensities of the THG emission as a function of the polarization of the excitation light. In addition to detection of the THG signal by the microscope objective, the two polarization components of the emission were also collected by two calibrated avalanche photodiodes. The polarization measurements were performed at varying angles for the polarized fundamental beams by rotating a half-wave plate.
Personally, I found this research to be very interesting. The ingenious principles behind the experiments were all new and different to what I had been exposed to during my previous research experiences as well as what I learned in the classroom. While I did not get to spend as much time in the lab as I would have liked to, the time I did get to spend there, I enjoyed learning about the different optical components and realized how difficult it can be to align laser beams. It’s a pretty delicate instrument. I also learned a lot about how expansive the application of optics and lasers is in all different kinds of research. My idea of optics research was very limited before this summer.
Finally, and probably the most important thing I learned this summer was how valuable collaborative work can be between different labs. My lab especially had many collaboration projects going on between different universities in Paris as well as internationally. All the schools involved benefit through the liaison between the labs by having access to the best technology and minds available in each of the labs. It really facilitates and optimizes the research done and creates opportunities for different cultural experiences as well. I will certainly keep this in mind in my future work.
Mir Henglin:
This summer I worked under Philippe Zeitoun at Laboratoire Optique Appliquée. His groups focuses on applications of extreme ultraviolet/soft X-Ray lasers. I worked on a project that aims to develop a technique to perform X-Ray holography. There is an interest in developing this technique to make three dimensional images and videos of biological molecules. For holographic imaging, the minimum size object that can be imaged is limited by the wavelength of the light being used for the imaging. In particular, you can’t image objects smaller than the wavelength of light being used. Biological molecules like water are of the same scale as the wavelength of light in the extreme ultraviolet/soft X-Ray range, and are thus perfect for imaging them.
The experiment I helped with was a test of a holographic method. The work I did can be divided into two parts. In the first part, I performed computer simulations to attempt to create holographic interference patterns. After, I worked on an algorithm that would reconstruct the original object from the interference patterns, based on Fourier Transform analysis. The purpose of this was to attempt to perfect the reconstruction algorithm before the experiment was run. The second half consisted with actually running the test. I helped in the laser lab to arrange optics and gather data. I worked with three other people in the laser lab to run the experiment. Unfortunately, a successful holographic reconstruction was not created. However, the results of this experiment will go to help experiments in the future.
Linda Lee:
A Grating-Based Pulse Shaper of a Femtosecond Fiber Laser: Applications for the Excitation of Nonlinear Microcavities
A grating-based pulse shaper of a femtosecond fiber laser is one of the intermediate stages of a larger setup which aims to shape the output laser pulse to excite a particular microcavity. The details of the overall project and its applications are confidential in nature, so this report will only consist of my work regarding the pulse shaper.
This setup functions as a four-pass system, which acts like a double grating pair. This allows for the twice the temporal dispersion while canceling out the angular dispersion. The grating-based pulse shaper can be used to alter the output shape and phase shape of the input beam. The setup uses a mirror and lens to image the laser beam on the mirror. The output shape is filtered by two adjustable razors. The phase shape can be altered by adjusting the position of the mirror along the axis of the beam, which creates a difference between the focal length and the distance from the mirror to the lens. If this distance is the same, then the resulting beam will have no dispersion in the focal plane. If the distance is not the same, a dispersion proportional to the difference betweent he two distances will be introduced, which ultimately changes the phase shape.
My responsibilities for the summer included building the grating-based pulse shaper, working with high-power lasers, and conducting experiments to verify fundamental laws and various parameters’ re- lationships. Because all previous work on this setup had been theoretical, I spent time verifying fun- damental laws which govern the functionality of the system and experimentally recording how various parameters were related. Since all other calculations for this system and other stages in the overall project were calculated with those laws, it was crucial to verify that the setup was working as predicted.
For the setup, the laws/parameters at interest included the grating law, the reflectivity of the grating, the output power as a function of the incident angle, the output power as a function of wavelength, the output power as a function of the focal length, and the cutoff wavelength as a function of razor displacement. Fortunately, the results of each experiment were expected to closely match that of the simulations of the expected results, so no major alterations were made. Then, the setup could be used in conjunction with other stages. Also, this information was can be to bridge the gap between theoretical and experimental, optimizing the setup for power efficiency, and more.
In conclusion, this research internship has provided me with knowledge in non-linear optics, familiarity with optical components and simulation softwares outside my fiend, and introduced me to research across cultures and disciplines. My work at the Institut d’Optique under the group Manolia has been challenging yet enjoyable. Thanks go out to my supervisor, Nicolas Dubreuil, and my graduate student mentor, Jrmy Oden, for making this experience possible.
Andrew Kerr:
I have spent the summer working under Philippe Delaye and Margaux Barbier at the Institute d’Optique. I joined the members of the MANOLIA group focusing on research with microstructured optic fibers. We specifically worked with two types of fibers: a silica fiber and a chloroform-acetone filled hollow core fiber. Our experiment was set up to measure the dispersion of the fiber by examining the intensity of the laser pulse after traveling through the fiber. Analyses on the silica fiber were conducted throughout the beginning of the summer in order to prepare the experiment for the hollow core fiber. This technique is beneficial because it requires much more sensitivity to the optical setup and measurements to observe nonlinear effects in silica fibers than in hollow core fibers. These measurements were then used to extract information about the nonlinear optical phenomena occurring: self-phase modulation, the Kerr effect, parametric processes like four-wave mixing, and non-parametric processes like Raman or Brillouin scattering. All of these phenomena are of particular interest because their influence is magnified within microstructured fibers, as opposed to their subsidiary effects in the conventional solid silica fiber. I performed measurements on spectra data that primarily revealed these nonlinear effects from self-phase modulation and parametric amplification. However, the bulk of my summer was spent reviewing articles and reading through Govind Agrawal’s Nonlinear Fiber Optics (while sitting in his office). Within the lab I learned about the techniques of laser tuning and beam refining. This is a very delicate process that is dependent upon the pulse duration of the laser pump. I was also introduced to the proper maintenance and operation of a pump laser and how ours actually worked. The principle is elegantly simple–keep the reflection and primary beams aligned– yet the internal mirror and crystal setup to achieve this is concurrently so complicated. I accomplished a successful term of learning about nonlinear optic phenomena and observing how to conduct and analyze experiments in the field of nonlinear fiber optics.
Laura Maguire:
This summer I participated in a research internship at the Laboratoire de Photonique Quantique et Moléculaire (LPQM) at ENS Cachan as part of the Optics in the City of Lights iREU program. Under the direction of Mélanie Lebental, my project focused on exploration of the properties of optically-pumped polymer microcavity lasers, particularly on Fabry-Perot resonator cavities, which I investigated autonomously in the lab. Rather than beginning the project with one ultimate goal and a linear sequence of steps needed to achieve that goal, my investigations were of a more preliminary and open-ended nature, and became a series of mini-projects, each stage guided by the results of the previous week.
To begin, I attempted to characterize the spectral line-width properties of Fabry-Perot resonators (FPs). The individual spectral lines are significantly narrower than theory predicts. The lab proposed two competing hypotheses: the observed width might be due to the Schalow-Townes fundamental limit on line width, or alternatively that the spectrum is Fourier-limited. The former hypothesis predicts an inverse relationship between mean line width and pump laser fluence, while the latter predicts a direct relationship. By taking many spectra at various pump fluences and determining their mean line widths, I was able to examine this relationship. Perhaps due to the age of the cavities tested, a clear trend is not visible across several cavities or even several trials of the same cavity. Where a trend exists at all, there is a direct relationship between line width and pump energy. However, the trends are slight enough that this result is not conclusive, but merely suggests Fourier-limiting of the line widths. In addition, spectra taken while pumping various vertical positions along the long, narrow Fabry-Perot cavity indicate that there is no difference where the cavity is pumped.
During the month of July, my focus shifted to quasi-Fabry-Perot cavities (qFPs) with non-parallel cavity walls. The qFPs are characterized by their widths at top and bottom, with tilts ranging from 1 um over the cavity’s length of 1000 um to 20 um over the same distance. This type of cavity had not been previously studied by the lab group, so initially I simply recorded spectra and contrasted the results for true FPs and qFPs. Fourier analysis allowed for the optical path lengths of the dominant orbits in each cavity to be inferred. The lengths calculated for qFPs are intermediate between those corresponding to true FPs with widths similar to the qFP’s top and bottom widths. This suggests that the local width of the cavity at the position of the pump beam is important to the spectrum, a conclusion supported by the change in qFP spectra when the pump spot size is decreased. The spectra become cleaner and more similar to those of true FPs. Threshold pump fluences required for lasing were also determined for several qFPs. The threshold value increases as tilt increases, beyond the increase predicted due to loss of gain material with tilt.
In my free time, I explored Paris and took two international weekend trips, one to Bonn, Germany and one to Fribourg, Switzerland. This program has been a uniquely incredible opportunity to appreciate all that Paris has to offer while experiencing French culture both in the city and in my lab group. I especially enjoyed getting to know the multi-national group of students at LPQM.